Business highlights
Transition of consolidated management indicators
-
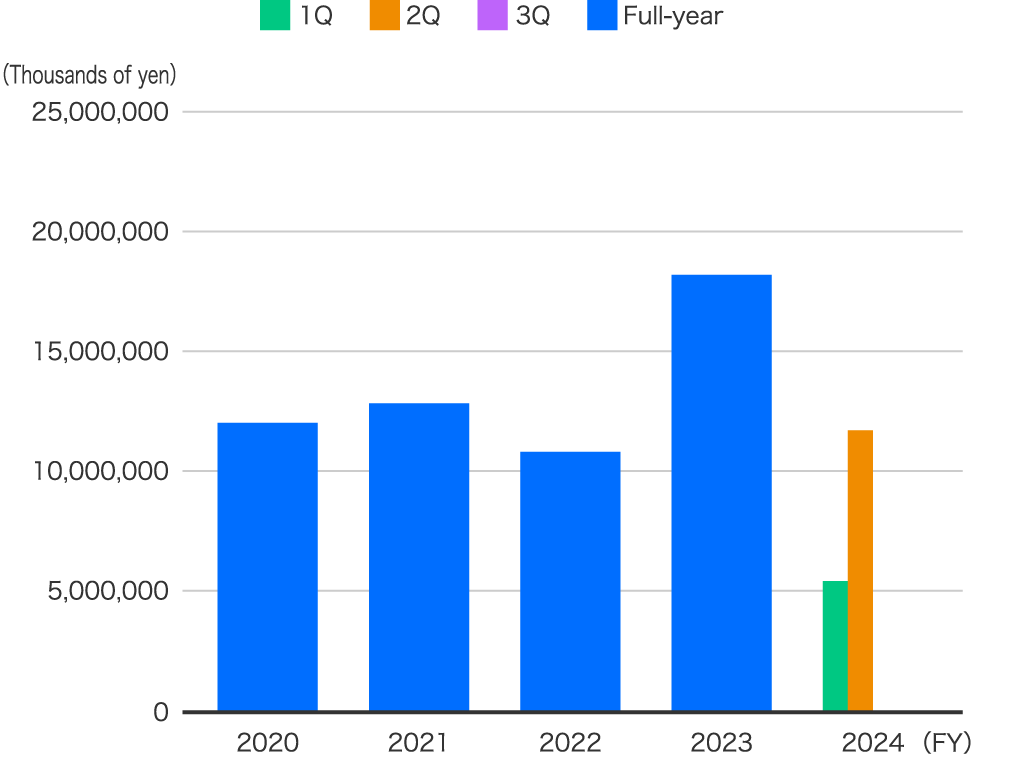
Net sales

-
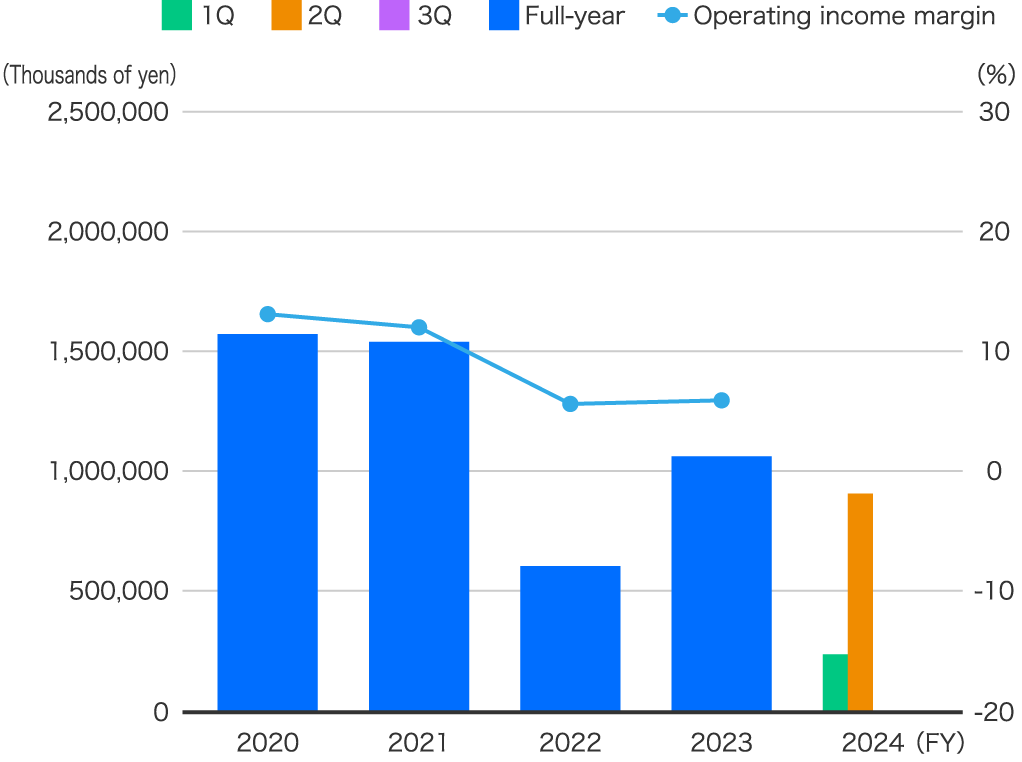
Operating income

-
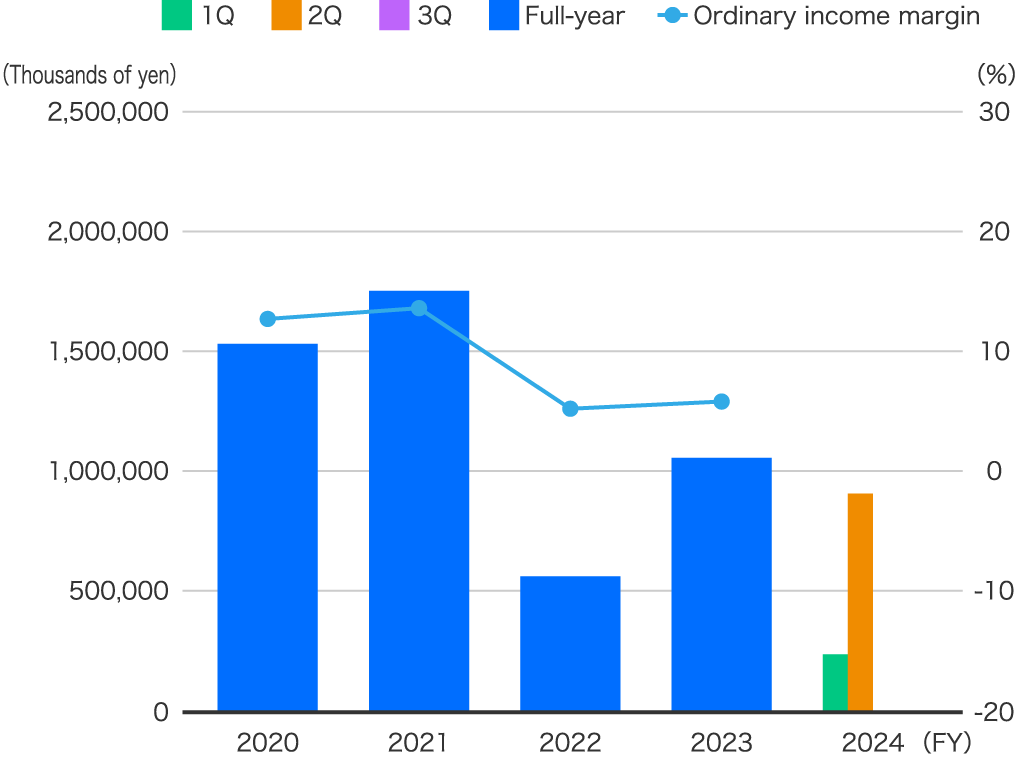
Ordinary income

-
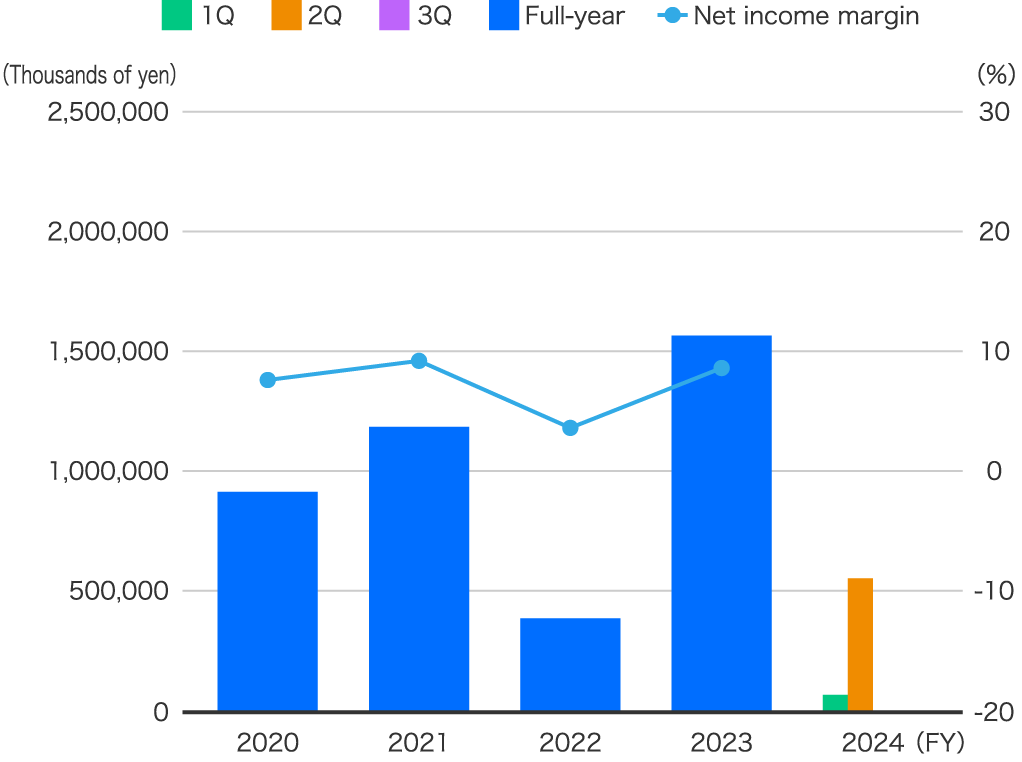
Net income attributable to owners of the parent

Changes in the current fiscal year
(Unit: Thousand Yen)
| 1Q | 2Q | 3Q | Full-year | |
| Net sales | 5,429,831 | 11,681,365 | 0 | 0 |
| Operating income | 240,710 | 906,154 | 0 | 0 |
| Ordinary income | 238,636 | 893,153 | 0 | 0 |
| Net income | 71,193 | 554,759 | 0 | 0 |
*Net sales do not include consumption tax or similar added expenses.
Changes in prior fiscal years
(Unit: Thousand Yen)
| FYE March 2019 | FYE March 2020 | FYE March 2021 | FYE March 2022 | FYE March 2023 | |
| Net sales | 9,723,502 | 11,994,283 | 12,806,882 | 10,793,510 | 18,127,781 |
|---|---|---|---|---|---|
| Operating income | 542,400 | 1,567,055 | 1,535,326 | 606,042 | 1,061,991 |
| Operating income margin (%) | 5.6 | 13.1 | 12.0 | 5.6 | 5.9 |
| Ordinary income | 271,556 | 1,527,589 | 1,747,770 | 563,033 | 1,054,162 |
| Ordinary income margin (%) | 2.8 | 12.7 | 13.6 | 5.2 | 5.8 |
| Net income | 598,280 | 913,946 | 1,182,792 | 389,112 | 1,561,153 |
| Net income margin (%) | 6.2 | 7.6 | 9.2 | 3.6 | 8.6 |
*Net sales do not include consumption tax or similar added expenses.
Management indicators for the submitting company
(Unit: Thousand Yen)
| FYE March 2019 | FYE March 2020 | FYE March 2021 | FYE March 2022 | FYE March 2023 | |
| Net sales | 7,208,509 | 9,540,944 | 8,174,635 | 6,423,610 | 8,539,919 |
|---|---|---|---|---|---|
| Operating income | 275,045 | 1,186,423 | 1,051,609 | 16,666 | 141,080 |
| Ratio of operating income to net sales (%) | 3.8 | 12.4 | 12.9 | 0.3 | 1.7 |
| Ordinary income | 37,936 | 1,162,760 | 1,172,908 | 97,701 | 329,304 |
| Ratio of ordinary income to net sales (%) | 0.5 | 12.2 | 14.3 | 1.5 | 3.9 |
| Net income on net sales | 345,043 | 683,592 | 835,247 | 107,751 | 278,548 |
| Ratio of net income to net sales (%) | 4.8 | 7.2 | 10.2 | 1.7 | 3.3 |
*Net sales do not include consumption tax or similar added expenses.
